

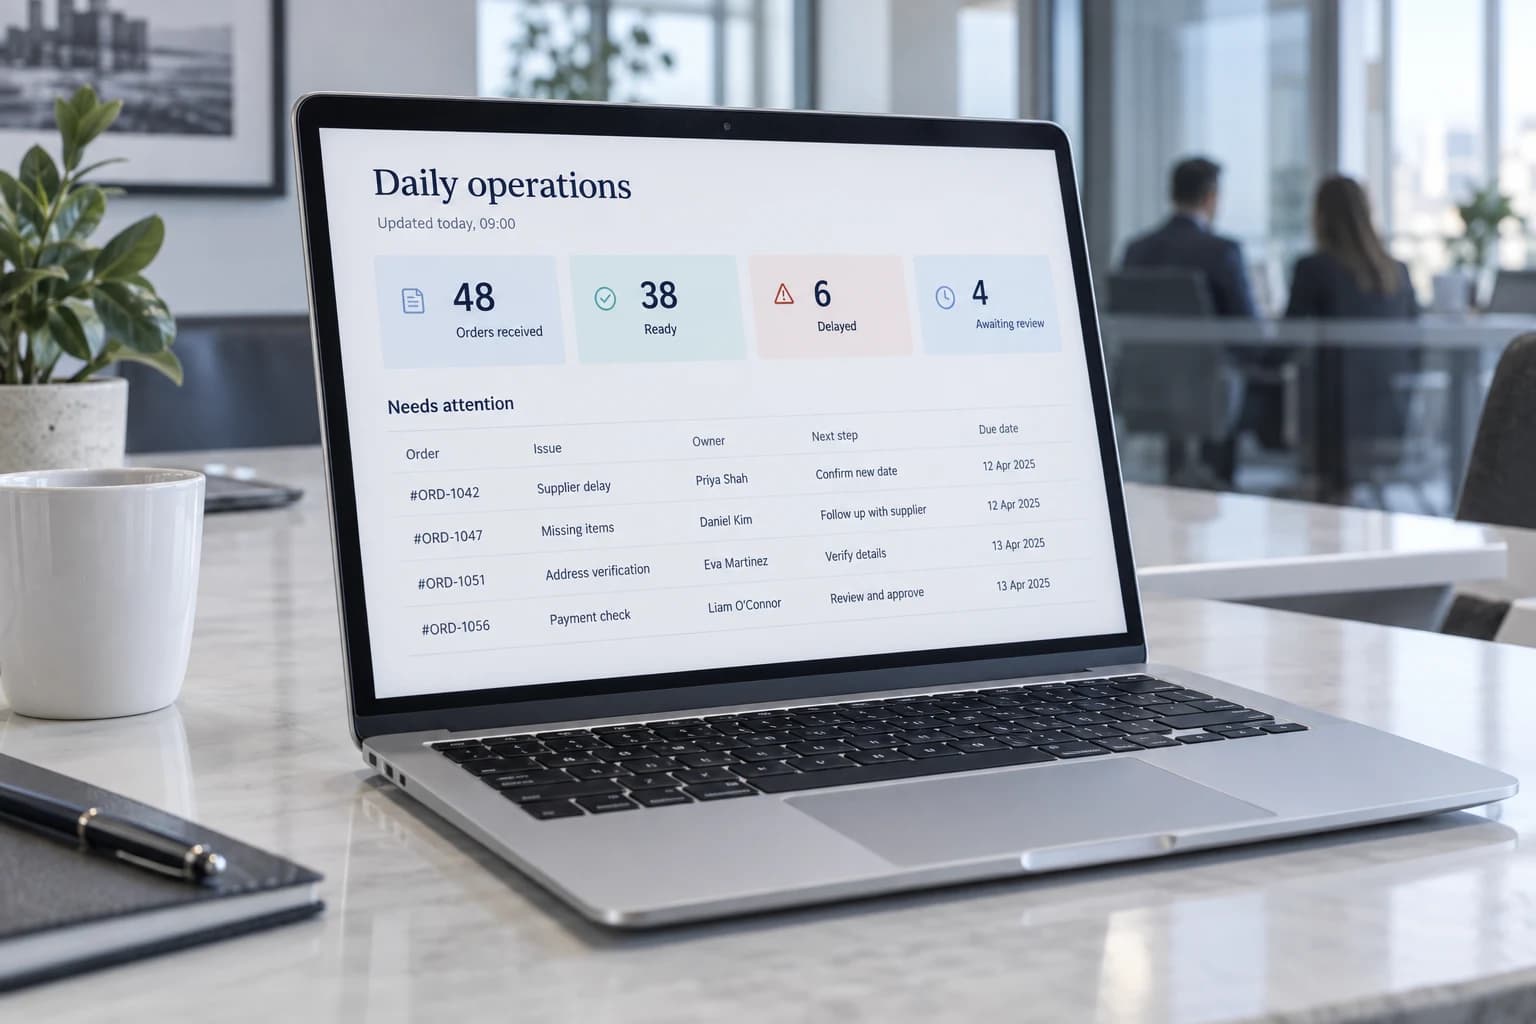
Daily operations
See orders, available stock and delivery delays together. Move from the overall position to the individual records that need someone to act.
Business Data & Reporting
Your sales, stock and finance systems each hold part of the picture. We bring the relevant information together into reports your team can use, with clear definitions and update times. Spend less time combining spreadsheets and more time understanding what needs attention.
Talk through your workflowSound familiar?
Business visibility
A useful report tells your team where to focus. We bring sales, stock and delivery information together so a manager can see what is ready, what is delayed and who needs to act.
The summary connects to the records behind it. When a number needs explaining, your team can find the affected orders and their owners instead of requesting another spreadsheet.
Clear definitions and visible update times help everyone understand what the figures include.
See the difference
Agree what each measure means, connect the relevant records and make the freshness of the information visible.
Shared definitions & matched records
Northline · Daily operations
One cut-off. Three clear states.
Figures share an agreed reporting cut-off. A delayed source is flagged, not silently treated as current.
Where automation can help
A focused starting point can make the next step clearer. These are the areas we can explore around your existing systems.
See orders, available stock and delivery delays together. Move from the overall position to the individual records that need someone to act.
Prepare daily or weekly summaries from connected sources. Your team reviews the figures instead of repeating the same exports and spreadsheet work.
Bring customer history and sales records together to understand buying patterns, outstanding quotes and accounts that need a follow-up.
Make agreed business information available to an AI assistant. Staff can ask questions in plain language, within the access permissions you set.
One workflow, end to end
An operations lead wants a reliable view of orders before the team starts work. Sales, stock and dispatch records already exist, but nobody sees them together.
Define received, ready, delayed and awaiting review. Choose a reporting cut-off and the source responsible for each fact.
Join orders, stock and dispatch information using stable references. Flag records that cannot be matched.
Show all 48 orders, each counted once: 38 ready, six delayed and four awaiting review. The team can see both the total and what is holding work up.
Let the team identify the underlying exceptions and their owners, rather than stopping at a headline number.
Potential business impact
Start with the current process. Agree what improvement would look like, then evaluate the workflow against it.
Reduce the repeated exports and joins behind routine updates.
Help teams understand why a number means the same thing across reports.
See which records need action, alongside the overall picture.
Understand the source, timing and limits of the information.
Behind the workflow
The technology follows the process: what needs to happen, which systems hold the information and who can authorise the next step.
We identify the sales, stock and finance records needed for your questions, then check how they can be read. Original references and update times stay attached so figures can be traced back to their source.
We define terms such as received, ready and delayed with your team. Totals are checked against the source records, and missing or duplicate entries are highlighted before they distort the report.
We can use your existing reporting tool or build a focused view where needed. We agree how often it updates and which people can see each part of the information.
Where this can be useful
Business Data & Reporting FAQs
Practical answers about the work, the systems involved, and the decisions your team keeps.
A first phase can focus on one set of decisions and the sources needed to support them. We scope data preparation, metric definitions, access, refresh frequency, and user review before estimating delivery. Reporting licences, hosting, and ongoing maintenance may add running costs; ownership and support are agreed before handover.
See delivery and support optionsWe can assess how supported exports, APIs, or connectors could bring the required data together. We first agree which sources are authoritative, how records match, and what each measure means. Access, file consistency, data quality, and licensing determine the scope of the connection.
Not always. We first look at the tools and reports your team already uses. Improving data feeds, definitions, or reconciliation may solve the problem. A new dashboard or reporting layer is considered when it adds a useful way to understand the work, with ownership and ongoing costs made clear.
We investigate definitions, identifiers, timing, and missing records before treating a combined report as reliable. For example, an order booked this month is not necessarily revenue collected this month. Exceptions and gaps should stay visible, with responsibility for correcting the source rather than silently inventing missing values.
Refresh frequency depends on source access, API limits, processing time, and the business need. Some measures suit frequent updates; others can refresh daily or on a schedule. We agree the required freshness and show when data was last updated so an older snapshot is not mistaken for live information.
Access can be scoped by role, data source, and the information needed for each task. We agree whether a user can see totals, drill into records, or export data, subject to the reporting platform's controls. Sensitive detail should not become visible simply because several systems feed the same report.
AI may help summarize or answer questions over approved data, but it does not make inconsistent records correct. We define which measures and sources it can use, test its responses, and provide references where supported. Important conclusions need validation against the underlying report and business context.
Next step
Tell us what you need to see and where the information lives. We can help you find a clearer path from scattered records to a useful business view.
Discuss your reporting needs